What the COVID‑19 Twitter Chatter Dataset Reveals
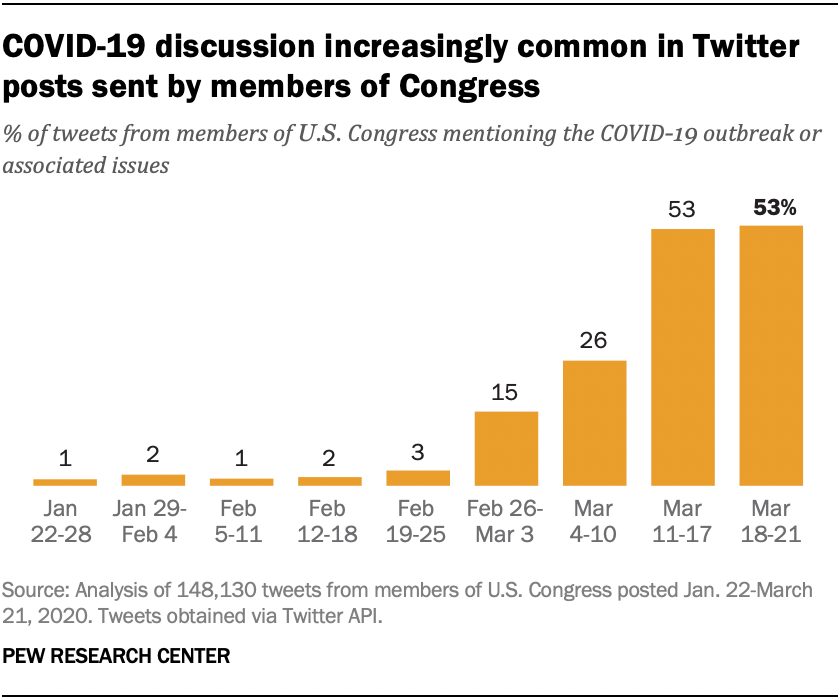
When the pandemic first erupted, the world’s conversation moved online at breakneck speed. Among the digital chatter, Twitter became a real‑time barometer of public sentiment, misinformation, and policy reaction. Researchers quickly harvested that stream, creating what is now commonly called the COVID‑19 Twitter chatter dataset. In the first hundred words of this piece, you’ll see why digging into those millions of posts can still teach us about health communication, behavioral shifts, and the social pulse of a crisis.
Why Twitter Is a Goldmine for Pandemic Research
Twitter’s open‑API design lets scholars scrape public posts without the legal hoops that accompany closed platforms. Unlike surveys that capture a snapshot, tweets arrive as a continuous flow, often minutes after an event unfolds. This immediacy offers a unique window into how people react to new case numbers, vaccine announcements, or policy changes. Moreover, the platform’s brevity forces users to condense complex feelings into bite‑size statements, making sentiment analysis more tractable.
Key Findings from the COVID‑19 Twitter Chatter Dataset
Analysts who have combed through the dataset—usually ranging from a few hundred thousand to several million tweets—consistently highlight three broad patterns:
- Sentiment swings mirror major news cycles. Peaks of optimism often follow vaccine approvals, while sharp drops coincide with reports of new variants.
- Misinformation clusters around high‑impact moments. For instance, rumors about “miracle cures” spiked whenever a celebrity mentioned a home remedy, illustrating the rapid contagion of false claims.
- Geographic hashtags reveal regional concerns. Users in the U.S. frequently paired #COVID19 with state‑specific tags like #NYC or #Texas, allowing researchers to map anxiety levels and compliance attitudes across the country.
These observations are not just academic curiosities; they have guided public‑health officials in tailoring messages to specific audiences, especially when combating vaccine hesitancy.
How Researchers Extract Meaning from Millions of Tweets
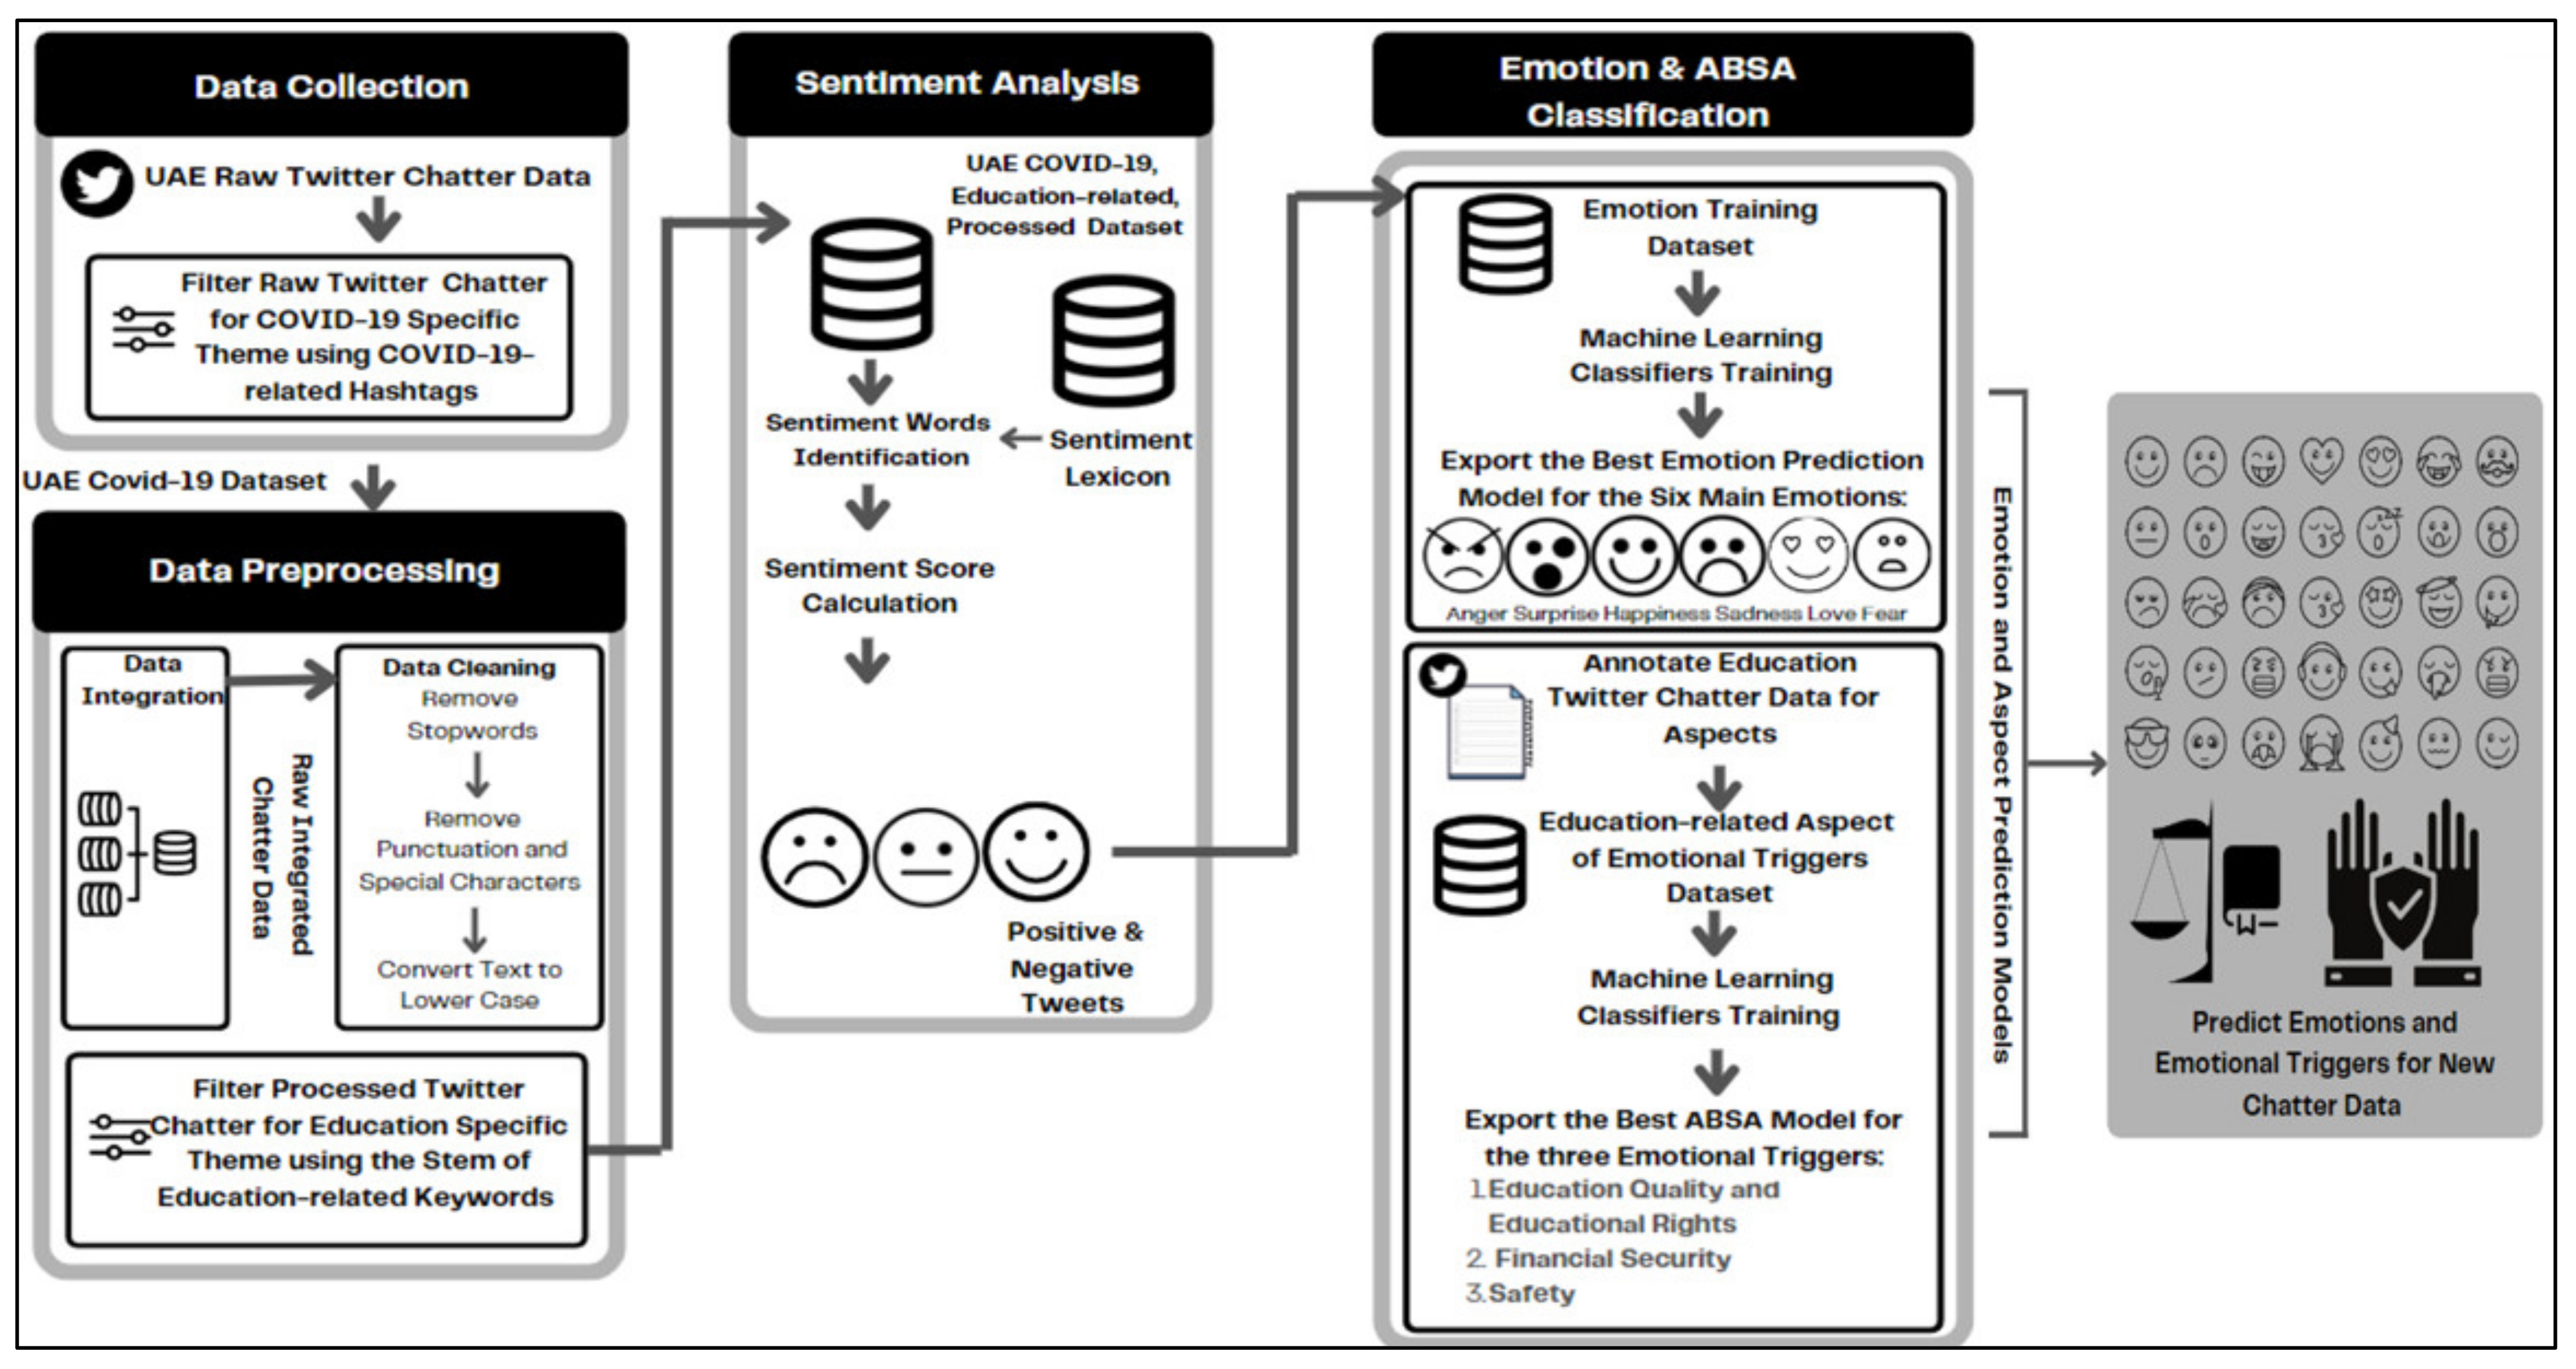
Typical workflows start with data cleaning—removing retweets, bots, and non‑English content to avoid skewed results. Next comes natural‑language processing (NLP): tokenizing words, assigning sentiment scores, and sometimes employing topic‑modeling algorithms like LDA (Latent Dirichlet Allocation). The goal is to surface recurring themes without manually reading every post. Some teams even overlay the Twitter timeline with official case counts, looking for lagged correlations that hint at how information spreads versus how disease spreads.
Limitations and Ethical Considerations
While the dataset is rich, it’s not without flaws. First, Twitter users are not a representative sample of the global population; younger, urban, and tech‑savvy individuals dominate the platform. Second, automated bots can inflate the volume of certain narratives, making it tricky to distinguish genuine concern from orchestrated propaganda. Ethically, scholars must balance public‑interest insights with user privacy—most analyses aggregate data to the level of trends rather than individual identities, but the line remains blurry.
Practical Takeaways for Public‑Health Communicators
If you’re crafting a health campaign, the dataset suggests a few concrete steps:
- Monitor real‑time sentiment around policy rollouts; a sudden dip may signal confusion that needs clarification.
- Identify and engage with influential users who consistently share accurate information; they can amplify correct messages faster than official accounts.
- Tailor content to regional concerns—what resonates in New York may fall flat in rural Texas.
In short, listening to Twitter isn’t about chasing every meme; it’s about spotting the underlying currents that shape public behavior.
Future Directions: Beyond Text
Emerging research aims to combine tweet text with metadata such as likes, retweets, and network graphs. By mapping who retweets whom, analysts can pinpoint “super‑spreaders” of both accurate information and misinformation. There’s also growing interest in multimodal data—images, videos, and even emojis—that add nuance to the textual narrative. As AI tools become more sophisticated, the next wave of pandemic analytics may blend these layers into a holistic, real‑time dashboard for decision‑makers.
FAQ
What time frame does the COVID‑19 Twitter chatter dataset usually cover?
Most public releases span from early 2020 to the end of 2022, capturing the pandemic’s most turbulent phases, though some researchers continuously update their collections.
Can the dataset predict future case surges?
It can suggest correlations—e.g., a rise in anxiety‑related tweets sometimes precedes a testing spike—but predictions remain probabilistic, not deterministic.
Is the dataset freely available?
Several versions are hosted on open‑access repositories like Harvard’s Dataverse, though larger raw dumps may require institutional credentials.
How do researchers handle non‑English tweets?
They either filter them out for language‑specific studies or employ multilingual NLP models to preserve the global perspective.