Understanding the Yield Curve: A Simple Finance Guide
The term “yield curve” pops up in headlines whenever markets wobble, yet many investors still ask, “What exactly is it?” In plain language, a yield curve is a graph that plots the interest rates of bonds having the same credit quality but different maturities. By looking at the curve, you can gauge how the market expects the economy to behave over the coming months and years.
What Is a Yield Curve?
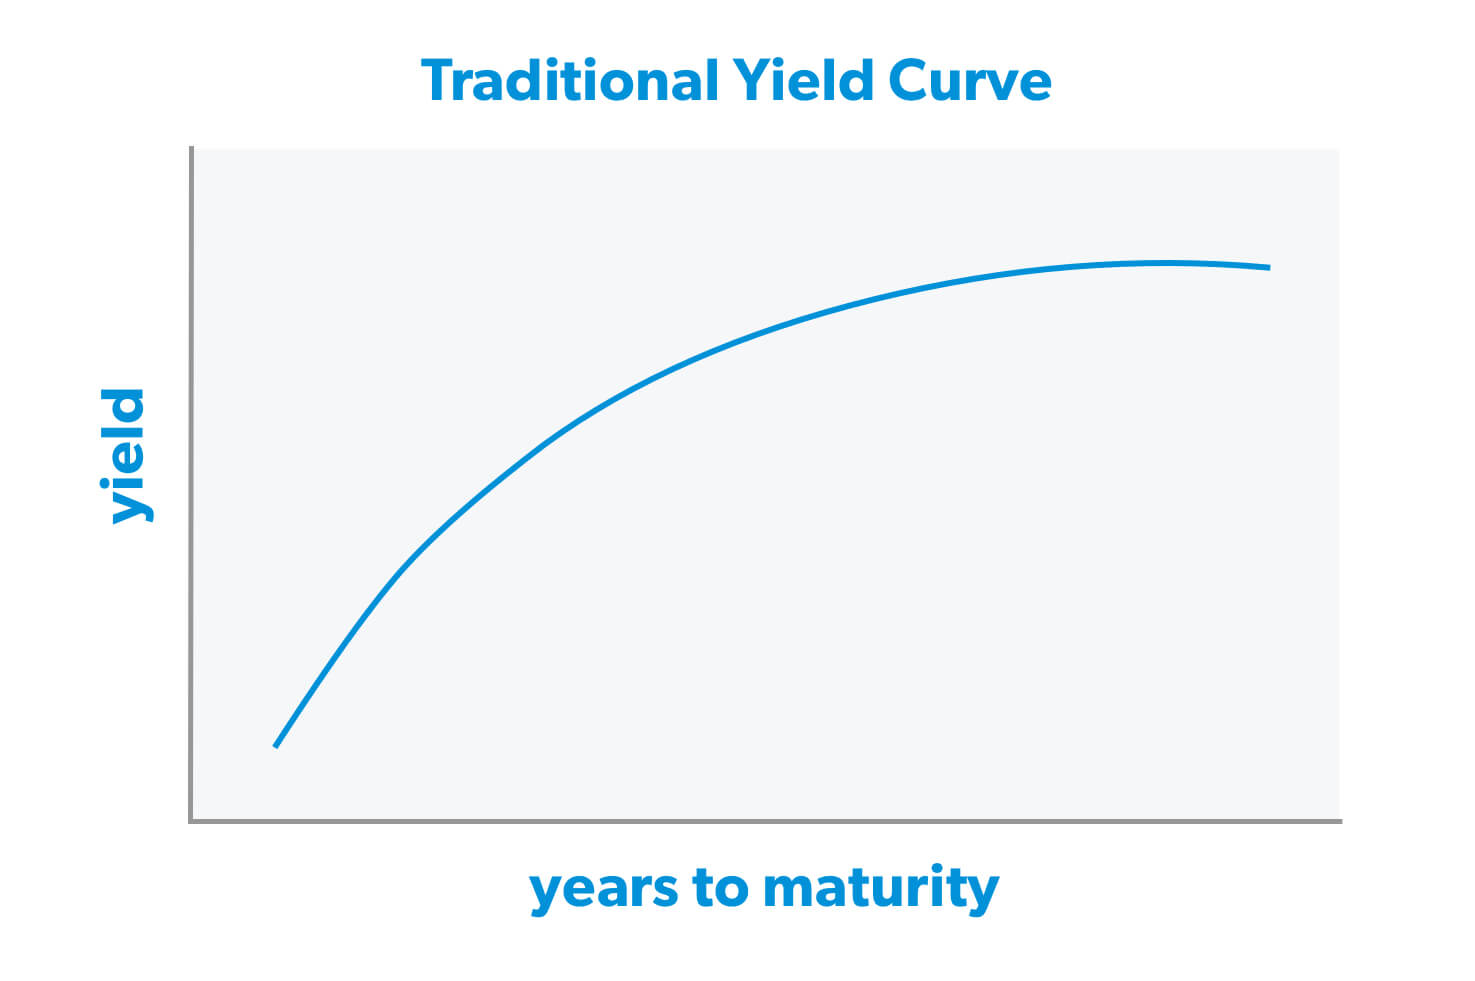
A yield curve is essentially a visual snapshot of the term structure of interest rates. Imagine three Treasury bonds: one that matures in three months, another in two years, and a third in ten years. Each pays a slightly different yield, and when you connect those points on a chart, the shape that emerges is the yield curve. The curve reflects investors’ collective expectations about future inflation, growth, and monetary policy.
How the Curve Is Built
To construct the curve, analysts collect the yields of government securities across a range of maturities—typically from one month up to thirty years. The data points are then plotted on a graph with the horizontal axis representing time to maturity and the vertical axis showing the annualized yield. Because Treasury securities are considered virtually risk‑free, the resulting curve serves as a benchmark for pricing other, riskier debt.
In practice, the curve is smoothed using statistical techniques so that it doesn’t look jagged. This smoothing helps economists and traders spot trends without being distracted by short‑term market noise. The most commonly quoted versions are the “normal” (upward‑sloping) curve, the “inverted” (downward‑sloping) curve, and the “flat” curve.
What the Shapes Tell Us
Normal upward slope. When longer‑term bonds pay higher yields than short‑term ones, investors expect modest growth and inflation ahead. This is the most frequent configuration and signals a healthy, expanding economy.
Inverted downward slope. If short‑term yields exceed long‑term yields, the market is betting that growth will slow or that a recession is on the horizon. Historically, an inverted curve has preceded many U.S. recessions, though the timing can vary from several months to a couple of years.
Flat or humped curve. When yields across maturities cluster together, it suggests uncertainty—perhaps the market can’t decide whether growth will pick up or falter. A “humped” shape, where medium‑term yields sit above both short and long ends, can indicate transitional phases in monetary policy.
Why It Matters to Investors
Bond traders use the curve to position themselves for expected interest‑rate moves. If they anticipate an upcoming rate hike, they might sell longer‑term bonds now, locking in higher yields before prices fall. Conversely, a flattening curve can be a cue for equity investors to shift toward defensive sectors, as lower long‑term rates often depress corporate earnings forecasts.
Beyond trading, the yield curve influences the cost of borrowing for everything from mortgages to corporate loans. A steep curve typically makes it cheaper for businesses to lock in long‑term financing, encouraging capital investment. When the curve flattens or inverts, lenders become more cautious, and loan rates may rise even as short‑term funding remains cheap.
Implications for Policymakers
Central banks watch the yield curve closely because it reflects market expectations of their own policy moves. If the curve steepens after a rate cut, it suggests that markets believe the easing will spur growth without igniting inflation. An inverted curve, however, can signal that the public doubts the central bank’s ability to sustain expansion, prompting a reevaluation of monetary stance.
In some countries, the yield curve also informs fiscal decisions. Governments may time the issuance of long‑dated debt when the curve is steep, taking advantage of higher yields to fund infrastructure projects at lower relative cost.
Common Misconceptions
One frequent myth is that a steep curve always guarantees strong growth. While a steepening often accompanies expanding activity, other factors—like supply‑side shocks or geopolitical risk—can distort the relationship. Likewise, an inverted curve is not an automatic recession alarm; it merely reflects prevailing market sentiment, which can shift quickly.
Another misconception is that the yield curve only matters to bond investors. In reality, the curve ripples through virtually every asset class, influencing everything from stock valuations to currency markets. Ignoring its signals can leave a portfolio vulnerable to macro‑economic swings.
Reading the Curve in Real Time
To keep tabs on the curve, many investors use tools like the Treasury yield website or financial platforms that display the “30‑year Treasury yield” alongside the “2‑year” and “10‑year” rates. Watching how the spread between the 2‑year and 10‑year yields changes day by day can provide early warning signs of shifting expectations.
It’s also helpful to compare the current curve to historical benchmarks. For instance, the spread that preceded the 2008 financial crisis narrowed well before the crash, offering a clue that markets were growing uneasy about future growth.
Practical Tips for Using the Yield Curve
- Monitor spreads, not just absolute yields. The difference between short‑ and long‑term rates tells a richer story than any single figure.
- Combine curve analysis with other indicators. Inflation data, employment reports, and corporate earnings can confirm or refute what the curve suggests.
- Adjust portfolio duration. When the curve steepens, extending bond duration can lock in higher yields; when it flattens, shortening duration can reduce exposure to falling prices.
- Stay aware of central‑bank communication. Forward guidance often moves the curve before policy actions actually occur.
FAQ
Q: Can the yield curve predict the exact timing of a recession?
A: No. The curve is a probabilistic indicator; it has historically signaled higher recession risk, but the lead time can vary widely.
Q: Does the yield curve affect stock market performance?
A: Indirectly, yes. A steepening curve often supports higher equity valuations by implying stronger future earnings, while an inverted curve can pressure stocks, especially growth‑oriented ones.
Q: How often does the Treasury publish updated yield curve data?
A: The U.S. Treasury releases yields for each maturity daily, and many financial platforms provide real‑time updates throughout the trading day.
Q: Should I invest in bond ETFs that track the yield curve?
A: It depends on your risk tolerance and outlook. Curve‑tracking ETFs can be useful for positioning, but they also carry interest‑rate risk that can amplify losses if the curve moves against you.