Mastering Markets with Elliott Wave Targets
What Are Elliott Wave Targets?
The Elliott Wave Principle is a framework that views market price movements as a series of waves, each reflecting underlying investor psychology. Elliott Wave targets are the projected price levels that correspond to the completion of these waves. By estimating where a wave is likely to end, traders can set entry points, stop‑losses, and profit exits with greater precision.
Why Targets Matter in Wave Theory
Simply spotting a wave pattern is only the first step. Without a clear target, a trade can wander indefinitely, exposing capital to unnecessary risk. Targets convert the qualitative assessment of a wave’s shape into actionable numbers, allowing the trader to measure performance against expectation.
Three Core Targeting Techniques
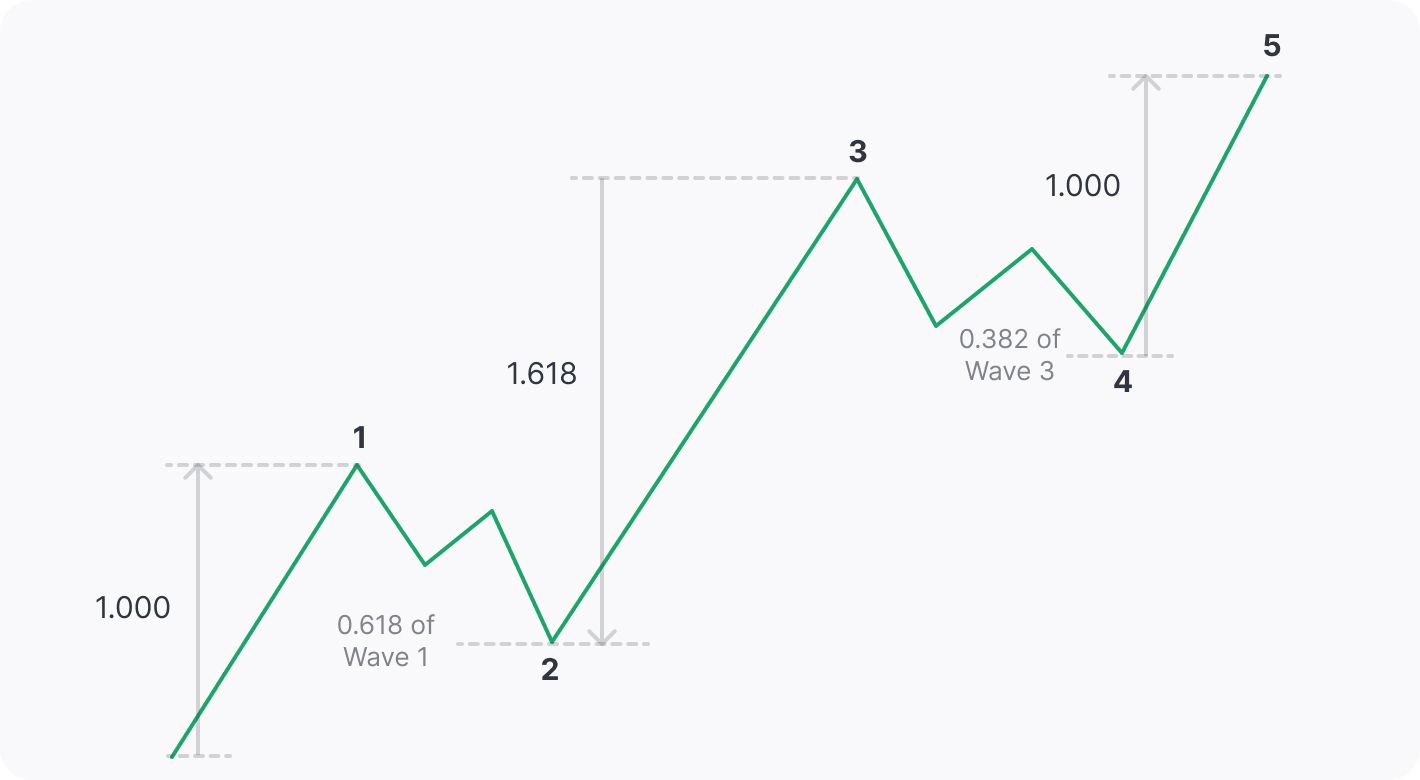
- Fibonacci Extensions – Apply the classic 61.8%, 78.6%, and 127.2% levels to the amplitude of a completed wave to predict where the next wave may conclude.
- Wave Height Ratios – Observe the relative size of adjacent corrective waves (A, B, C). A typical ratio is 1:1.618:0.618, which can provide a quick estimate of the next impulsive wave’s length.
- Dynamic Trend Lines – Draw trend lines across the peaks and troughs of the current wave. Where these lines intersect with the next wave’s high or low offers a practical target that adapts to market volatility.
Setting Accurate Wave Targets: A Step‑by‑Step Guide
- Identify the Current Wave – Determine whether you are in an impulse (waves 1, 2, 3, 4, 5) or a corrective (waves A, B, C) phase. Label the wave with Roman numerals for clarity.
- Measure the Wave Height – Calculate the difference between the start of the wave and its anticipated end. Use the highest and lowest price points within the wave.
- Select a Targeting Method – Choose one of the three core techniques based on market conditions and personal preference.
- Apply the Formula – For a Fibonacci extension, multiply the wave height by the chosen ratio (e.g., 1.618 for a 61.8% extension).
- Set Your Trade Levels – Place your entry near the wave’s current price, a stop‑loss below the wave’s low (or above a high for short trades), and an exit at the calculated target.
- Monitor and Adjust – As the wave unfolds, re‑measure and recalculate if new swing highs or lows appear, keeping the target realistic.
Common Pitfalls and How to Avoid Them
Even seasoned traders can fall into traps when using Elliott Wave targets. The most frequent mistakes include:
- Overlooking the wave rule of five, which states that the third wave in a five‑wave impulse is usually the longest.
- Ignoring the alternation rule, where the shape of the corrective waves often alternates between a 3‑wave and a 5‑wave pattern.
- Setting a target too close to the current price, which may trigger a stop‑loss prematurely.
- Failing to consider market context—such as macroeconomic news or earnings reports—that can invalidate a wave pattern.
Practical Examples Across Asset Classes
Equity Markets
During a bullish rally, a trader identifies wave 3 of a five‑wave impulse. Using a 61.8% Fibonacci extension on the wave height, the target lands 10% above the current price. The stop‑loss is set 5% below the wave’s low, giving a risk‑reward ratio of roughly 2:1.
Forex Markets
In a corrective phase, the trader sees a 3‑wave A‑B‑C pattern in EUR/USD. Applying the 0.618 ratio to the length of wave C suggests the next upward impulse may end around 0.8% above the current level. This modest target reflects the typically weaker momentum in corrective moves.
Cryptocurrency Markets
Bitcoin often swings rapidly, so a dynamic trend line method works well. A trader draws a line from the last swing high to the current trough. The line intersects the next swing high at a price 12% higher than the current market value, providing a clear exit point.
Integrating Elliott Wave Targets with Other Tools
Wave targets are most powerful when paired with complementary indicators:
- Volume Analysis – Rising volume on wave 3 confirms the strength of the impulse, while declining volume may signal a potential reversal.
- RSI & MACD – Oversold or overbought conditions can validate or contradict a wave target, prompting a reassessment.
- Price Action Patterns – Pin bars or engulfing candles near a projected target can reinforce the trade decision.
By layering these tools, the trader moves from a single‑source prediction to a multi‑evidence strategy, improving the odds of success.
FAQ
- What is the most reliable method for setting Elliott Wave targets? Fibonacci extensions are widely used due to their strong mathematical foundation and empirical support, but the best method depends on market volatility and the trader’s familiarity with each technique.
- Can Elliott Wave targets be used for short‑term trading? Yes. While the theory is often associated with longer‑term trends, wave targets can be applied to intraday charts by scaling the wave height and ratios accordingly.
- How often should I re‑calculate my wave targets? Anytime a new swing high or low is confirmed, a recalculation is advisable to keep the target aligned with evolving market dynamics.
- Do I need specialized software for Elliott Wave analysis? Basic charting platforms with Fibonacci tools and trend‑line capabilities are sufficient for most traders; advanced software can automate measurement but is not essential.